Table of Contents
Example
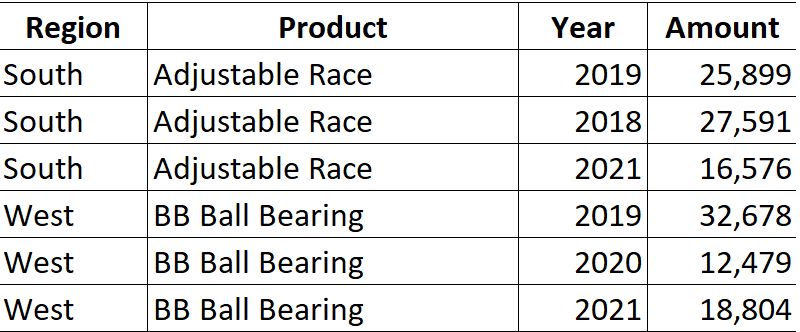
We have Region, Product and Year wise sales in a excel sheet. Now, we need to create multiple excel sheets containing year wise and region wise sales for each product.

Steps
Create a pivot table:
Select the data range, Go to Insert Tab –> Pivot Table –> Ok
Keep Region in Rows, Year in Columns, Amount in Values and Product in Filters
The field for which multiple sheets are required should be kept in Filters Area of the field list of the Pivot table.

Generate multiple sheets:
- Click on any cell in the Pivot table
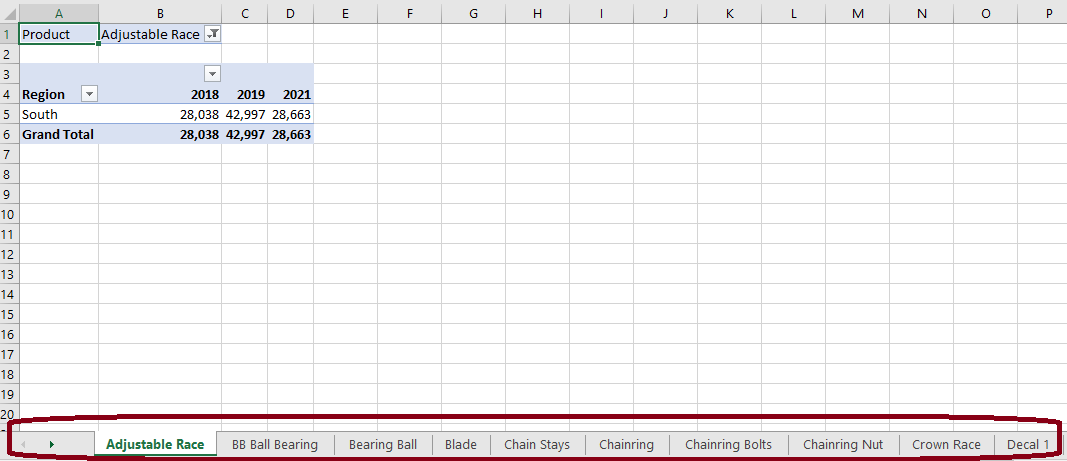
- Go to Analyse tab –> Pivot Table –> Options –> Click on Show Report Filter Pages –> Click Ok

Generate multiple sheets:
- Click on any cell in the Pivot table
- Go to Analyse tab –> Pivot Table –> Options –> Click on Show Report Filter Pages

Important
- Any changes done in the original Pivot table will not be reflected in the sheets generated using Report Filter Pages option.
- In case addition is made in the raw data
- Extend the data range using Change Data Source option in Analyse Tab
- Go to Analyse tab –> Click on the arrow icon on Refresh –> Refresh All
All the pivots in the current workbook will be updated.
